
Model Diagnostics and Residual Analysis
Source:vignettes/model-diagnostics.Rmd
model-diagnostics.RmdIntroduction
In Small Area Estimation (SAE), model-based estimators borrow strength across domains and time to improve estimation precision over direct survey estimators. However, introducing model assumptions carries the risk of model misspecification, bias, and inappropriate shrinkage.
To address these challenges, fastsae provides a
unified diagnostic framework centered on the diagnose()
function and its dedicated S3 autoplot() visualization
method. It evaluates both frequentist C++ EBLUP models
(eblup_fh, eblup_sfh, eblup_stfh,
eblup_bhf) and Bayesian INLA HB models
(hb_area).
Core Diagnostic Criteria
The diagnostic workflow evaluates four fundamental dimensions of SAE model quality:
- Precision Gain & RSE Reduction: Quantifies the improvement in Relative Standard Error () compared to direct survey estimates. Evaluates whether areas satisfy the official statistics reliability threshold (typically or ).
-
Goodness-of-Fit Statistic (Brown et al., 2001):
Computes the Chi-square diagnostic statistic
over the sampled domains:
and compares it with
.
Only large values indicate that the model estimates differ from the
direct estimates by more than their uncertainty, so the p-value is
upper-tailed (as in
emdi). The statistic ignores the positive correlation between and , so it is conservative: under a correct model is usually well below . -
Bias Diagnostic (Brown et al., 2001): The
regression of the direct estimates on the model estimates,
is reported descriptively (with
autoplot(type = "calibration")) to look for systematic deviations. It is not used as a formal test of : for shrinkage estimators such as the EBLUP the slope exceeds 1 even when the model is correct (about for the variation not explained by the covariates), so such a test would reject correct models. - Residual Spatial Autocorrelation (Moran’s I): Verifies whether spatial autocorrelation has been fully captured by the model random effects. Significant residual spatial clustering indicates that unmodeled spatial patterns remain.
Practical Example: Diagnosing a Fay-Herriot Model
We demonstrate the diagnostic workflow using the built-in
mys dataset (Mean Years of Schooling in 42 regencies):
1. Fit Model and Run diagnose()
library(fastsae)
library(ggplot2)

data("mys")
data("mys_proxmat")

# Fit Area-Level Fay-Herriot model
fit_fh <- eblup_fh(
  formula = y ~ x1 + x2 + x3,
  vardir = ~vardir,
  data = na.omit(mys),
  method = "REML",
  print_result = FALSE
)

# Run comprehensive diagnostic checks
diag_fh <- diagnose(fit_fh, W = mys_proxmat[!is.na(mys$y), !is.na(mys$y)])
print(diag_fh)
2. Inspect Diagnostic Components
The resulting fastsae_diagnose object provides
structured access to each diagnostic domain:
# Efficiency gains
diag_fh$precision
#> $rse_threshold
#> [1] 25
#>
#> $prop_reliable
#> [1] 68.75
#>
#> $mean_direct_rse
#> [1] 29.49003
#>
#> $median_direct_rse
#> [1] 19.72062
#>
#> $mean_sae_rse
#> [1] 21.63848
#>
#> $median_sae_rse
#> [1] 17.03635
#>
#> $eff_ratio_summary
#>      Min   Q1.25%   Median     Mean   Q3.75%      Max
#> 1.017672 1.194006 1.291102 1.529910 1.491337 3.907487
#>
#> $prop_gain
#> [1] 100

# Calibration test results
diag_fh$brown_test
#> $bias_regression
#> $bias_regression$alpha
#> [1] -0.7316943
#>
#> $bias_regression$beta
#> [1] 1.155679
#>
#> $bias_regression$se_alpha
#> [1] 0.363461
#>
#> $bias_regression$se_beta
#> [1] 0.0652052
#>
#> $bias_regression$r_squared
#> [1] 0.9128237
#>
#> $bias_regression$n
#> [1] 32
#>
#>
#> $goodness_of_fit
#> $goodness_of_fit$w_stat
#> [1] 4.525856
#>
#> $goodness_of_fit$df
#> [1] 32
#>
#> $goodness_of_fit$crit
#> [1] 46.19426
#>
#> $goodness_of_fit$p_value
#> [1] 1
#>
#> $goodness_of_fit$is_good_fit
#> [1] TRUE

# Moran's I spatial test on residuals
diag_fh$spatial_test
#> $moran_I
#> [1] -0.1196823
#>
#> $expected_I
#> [1] -0.03225806
#>
#> $sd_I
#> [1] 0.1105189
#>
#> $z_stat
#> [1] -0.7910343
#>
#> $p_value
#> [1] 0.428924
#>
#> $no_residual_autocorrelation
#> [1] TRUE
Visual Diagnostics with autoplot()
fastsae implements dedicated ggplot2 visualization types
for fastsae_diagnose objects:
1. Calibration Plot (type = "calibration")
Plots direct survey estimates against model predictions along with the 1:1 identity line and the fitted calibration regression:
autoplot(diag_fh, type = "calibration")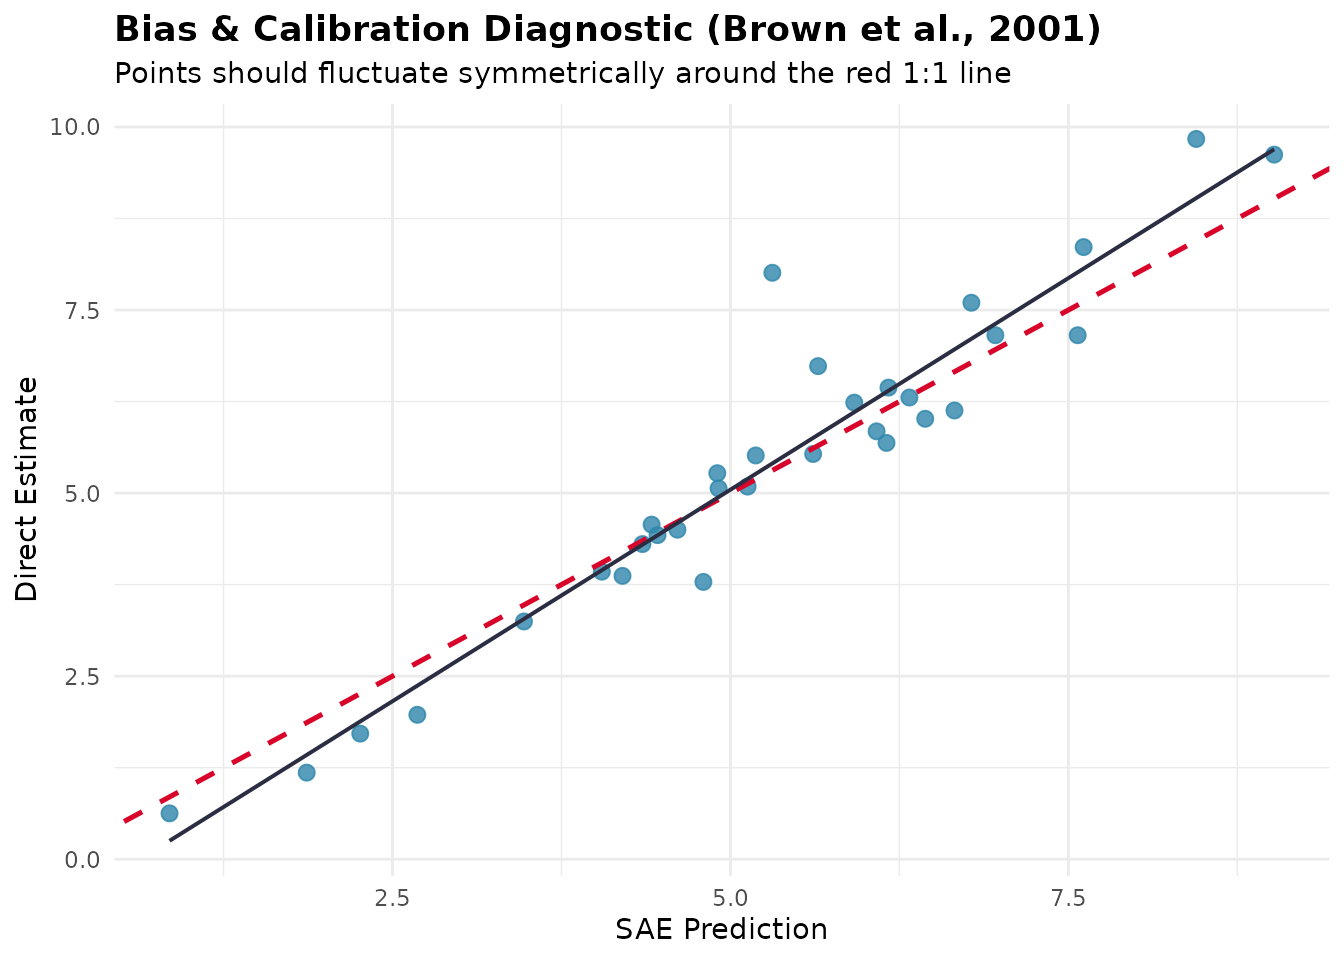
2. Precision Comparison (type = "rse")
Visualizes the domain-by-domain reduction in Relative Standard Error:
autoplot(diag_fh, type = "rse")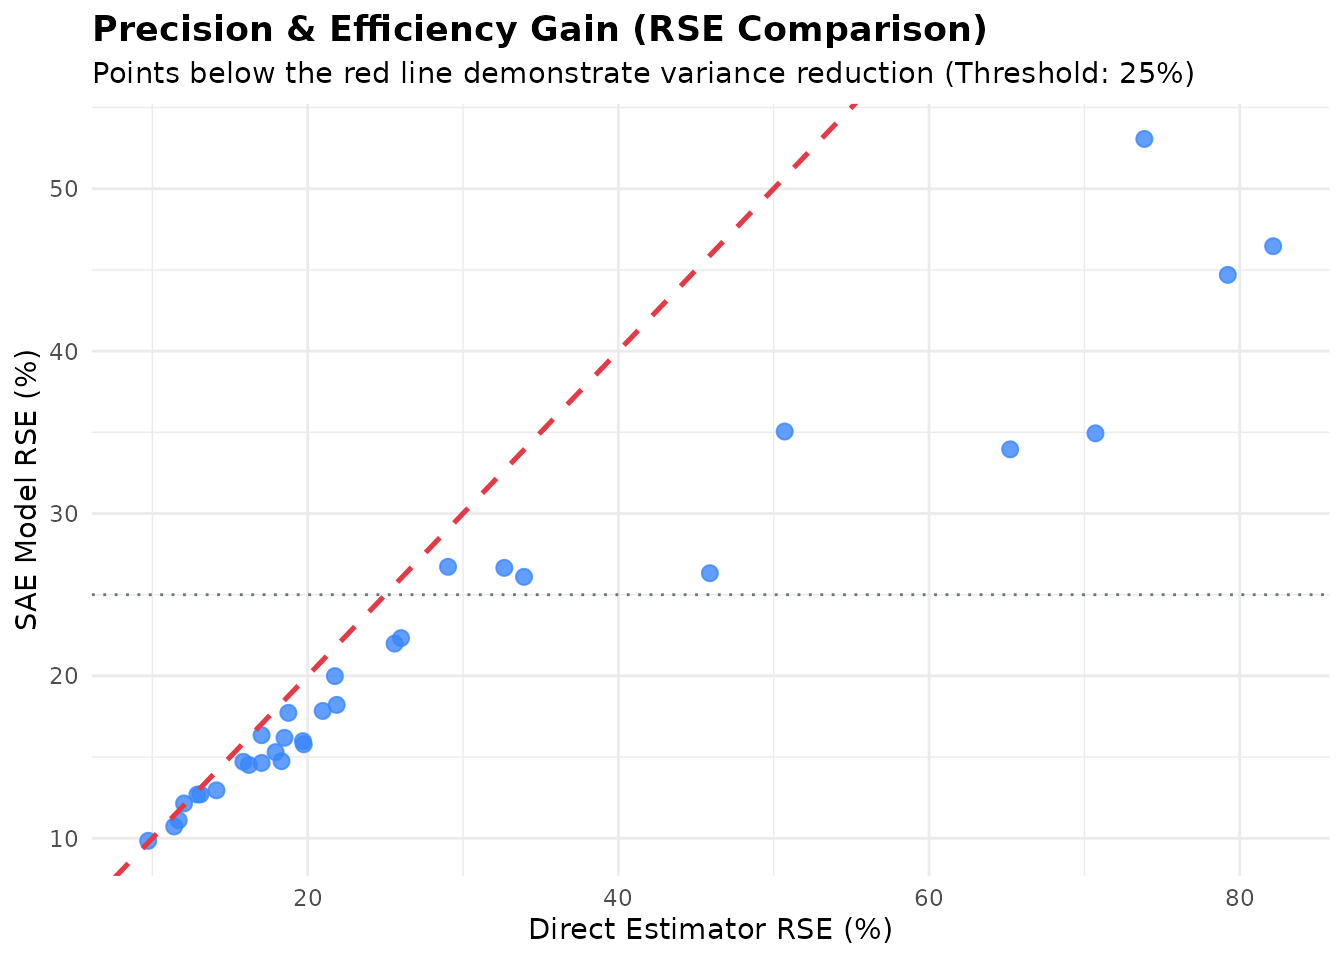
3. Residual Diagnostics (type = "residuals" &
type = "qq")
Inspect standardized residuals against fitted values to detect heteroscedasticity, non-linearities, or outliers:
autoplot(diag_fh, type = "residuals")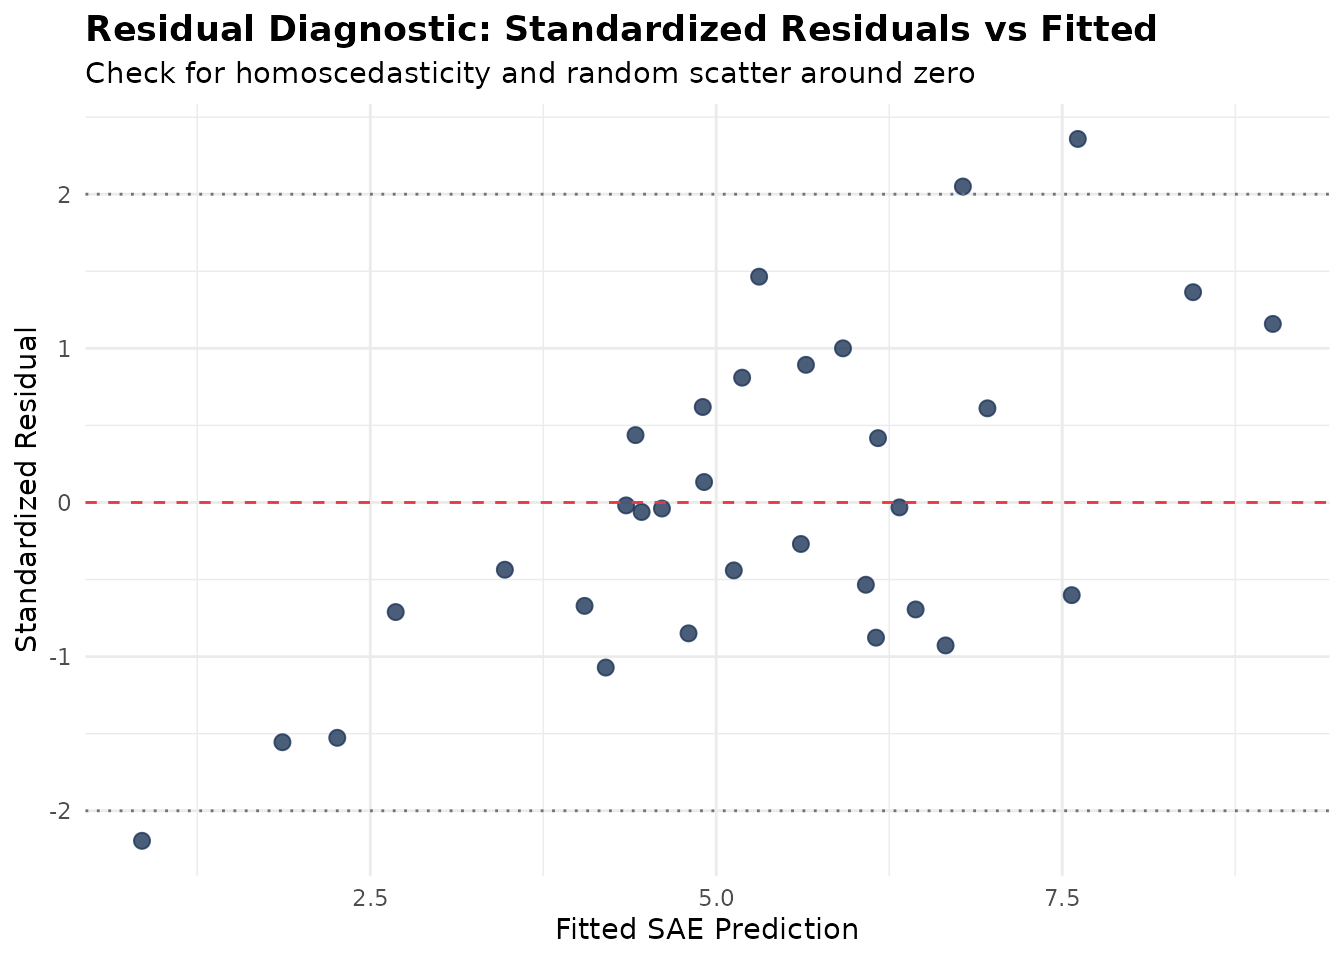
autoplot(diag_fh, type = "qq")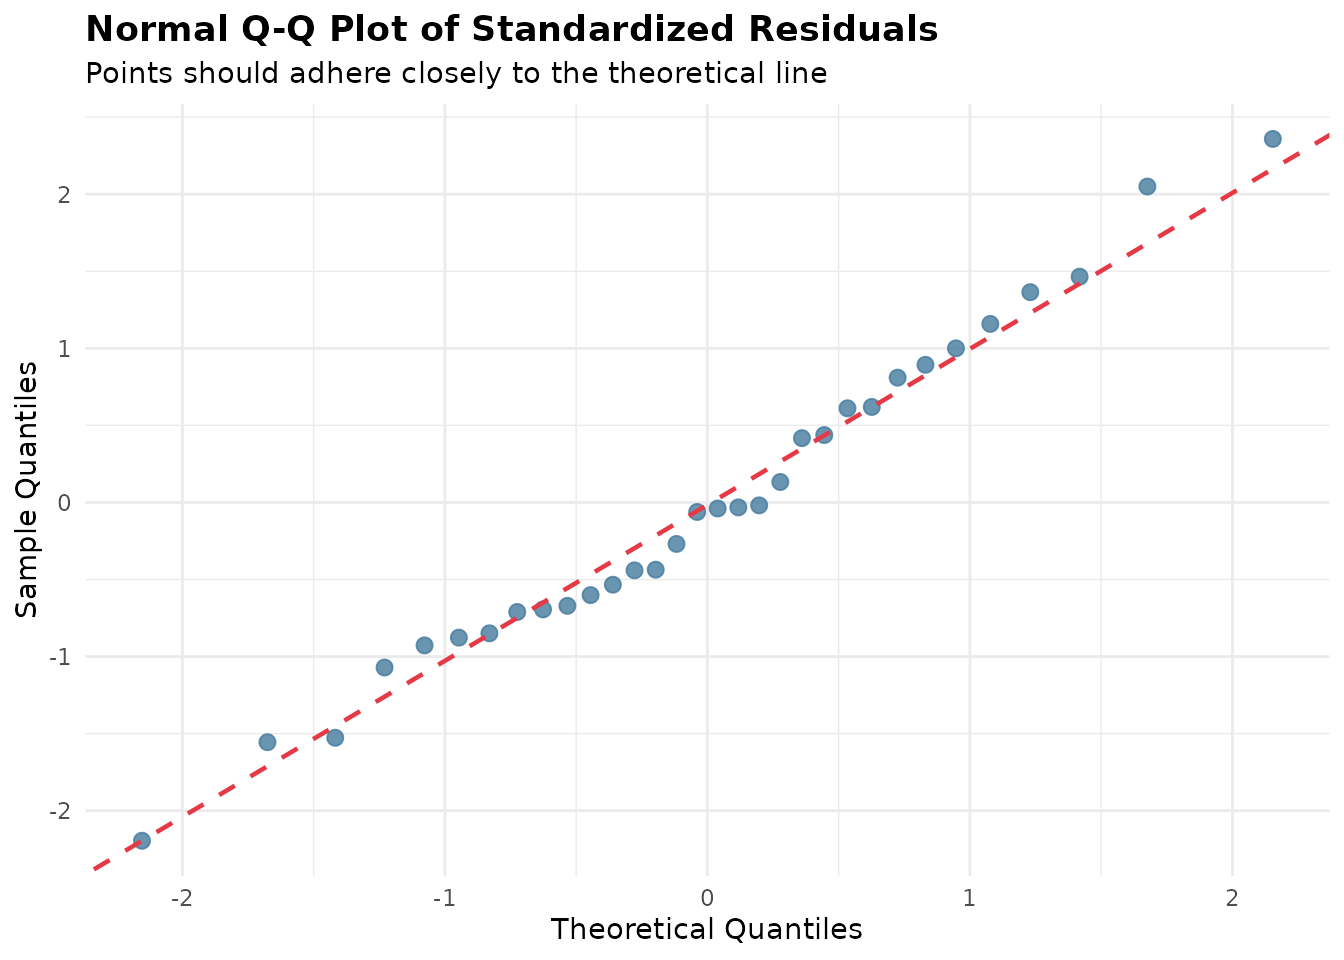
4. Combined Diagnostic Dashboard (type = "all")
Generates a unified diagnostic view summarizing calibration and precision gains:
autoplot(diag_fh, type = "all")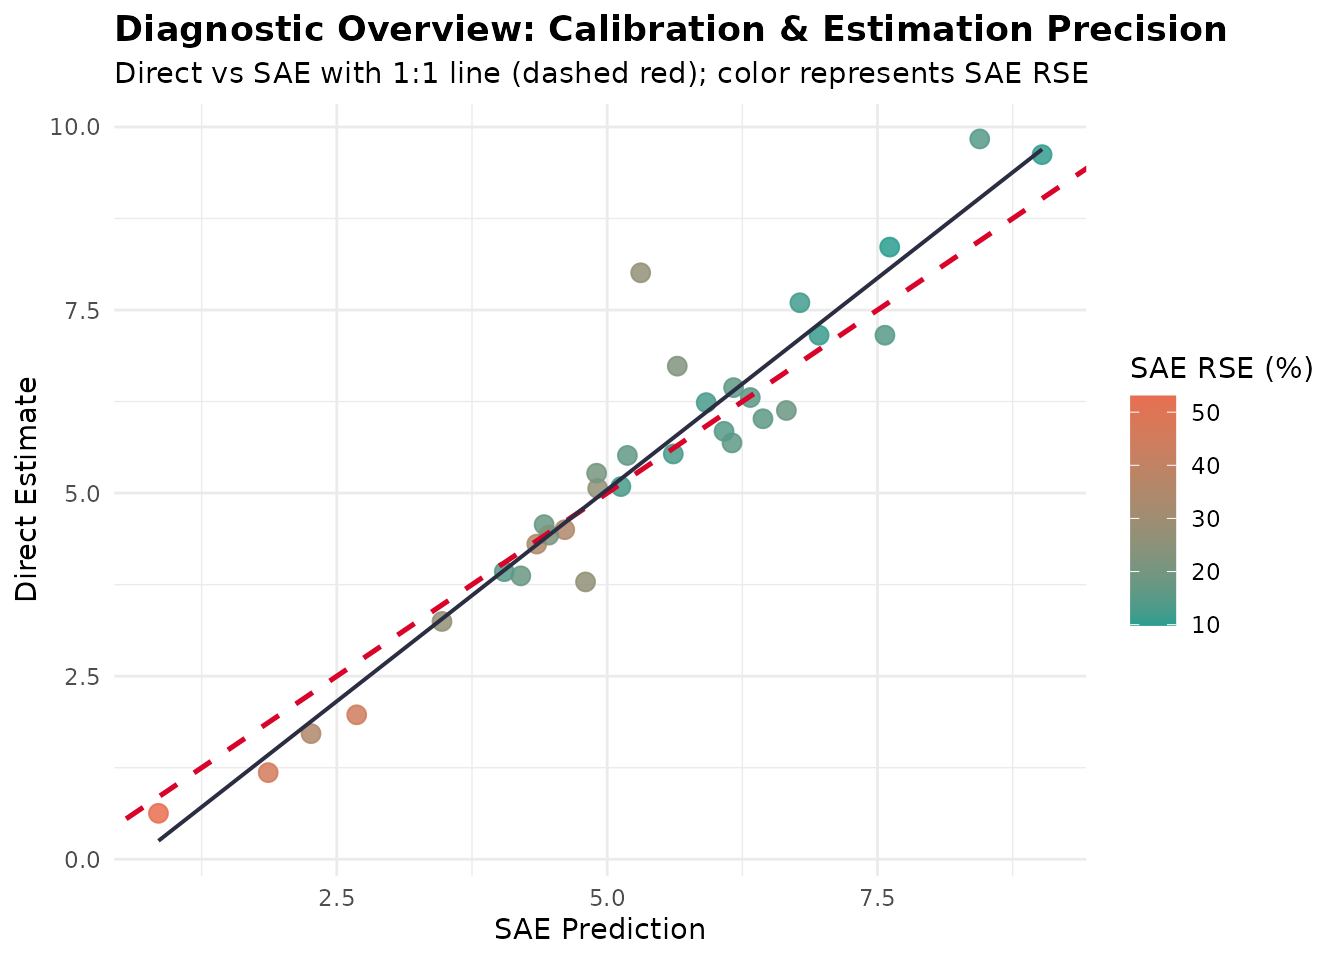
Diagnosing Bayesian Spatio-Temporal Models
The exact same diagnose() function applies directly to
Bayesian models fitted with hb_area():
data("sim_area", package = "fastsae")

# Fit Spatial EBP model with BYM2 prior
fit_hb <- hb_area(
  formula = y_gaussian ~ x1 + x2,
  data = sim_area,
  vardir = "vardir",
  spatial = "bym2",
  W = create_weights(cbind(sim_area$x_coord, sim_area$y_coord), method = "knn", k = 4),
  print_result = FALSE
)

# Diagnose Bayesian model
diag_hb <- diagnose(fit_hb)
diag_hb$precision
#> $rse_threshold
#> [1] 25
#>
#> $prop_reliable
#> [1] 64.28571
#>
#> $mean_direct_rse
#> [1] 103.231
#>
#> $median_direct_rse
#> [1] 17.64954
#>
#> $mean_sae_rse
#> [1] 70.4932
#>
#> $median_sae_rse
#> [1] 19.57028
#>
#> $eff_ratio_summary
#>      Min   Q1.25%   Median     Mean   Q3.75%      Max
#> 1.108100 1.238707 1.281716 1.288164 1.357667 1.459159
#>
#> $prop_gain
#> [1] 100
diag_hb$status
#> [1] "WARNING: High proportions of domains with RSE >= threshold."
References
- Brown, G., Chambers, R., Heady, P., & Heasman, D. (2001). Evaluation of small area estimation methods: An application to unemployment estimates from the UK LFS. Proceedings of Statistics Canada Symposium 2001: Achieving Data Quality in a Statistical Agency.
- Fay, R. E., & Herriot, R. A. (1979). Estimates of income for small places: An application of James-Stein procedures to Census data. Journal of the American Statistical Association, 74(366), 269–277.
- Rao, J. N. K., & Molina, I. (2015). Small Area Estimation (2nd ed.). John Wiley & Sons.