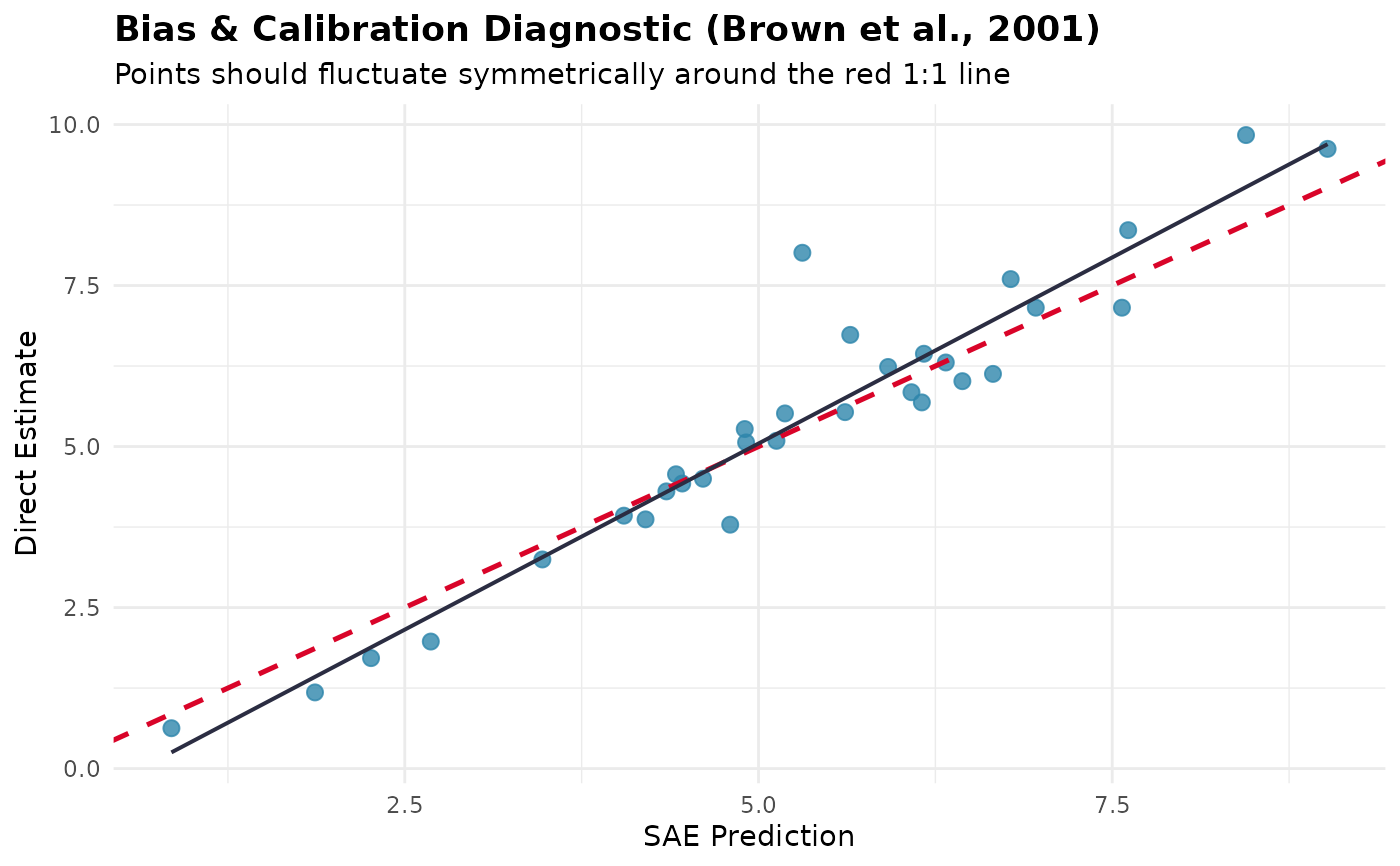
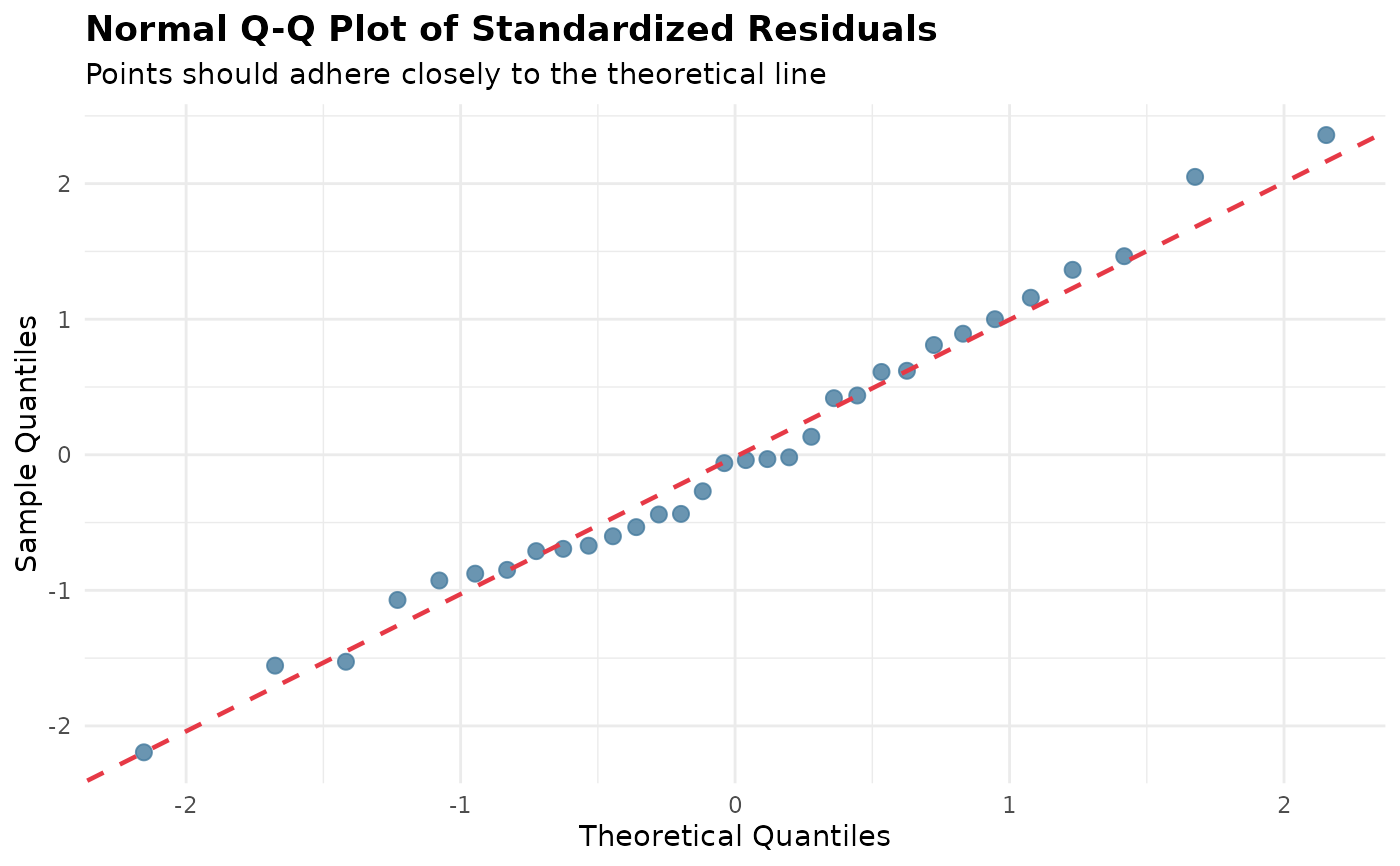
Generates diagnostic visual inspections for small area estimation models evaluated
via diagnose.
Arguments
- object
An object of class
"fastsae_diagnose"returned bydiagnose.- type
Character string indicating the diagnostic plot type:
"all": Combined multi-metric inspection (Calibration and RSE reduction)."calibration": Direct estimates vs SAE predictions with 1:1 identity line."rse": RSE comparison between direct estimator and model-based predictions."residuals": Standardized residuals versus fitted values."qq": Normal Q-Q plot of standardized residuals.
- ...
Additional arguments passed to ggplot2 layers.